

While managing a team of 40 ETL developers, I wanted to track lots of metrics. Some of the things I wanted to track were technical, like SSIS package execution times. Some metrics were people-centric.
Andy’s First Rule of Statistics states:
You can use statistics for anything about people, except people.
Andy – circa 2005
It was important to me to track how long it took the on-call person to identify the problem. I didn’t use the information to beat on-call people over the head. I used the information to measure the results of several experiments for displaying metadata about the failure.
Reports For The Win
You may be as shocked by this as I was; reports helped a lot more than I anticipated. Before I deployed the reports the Mean Time to Identify Failure was tracking just under 30 minutes. After deploying the reports, the mean time to identify failure fell to 5 minutes.
As I said, I was shocked. There were mitigating circumstances. The on-call team members were getting more familiar with the information SSIS produces when it logs an error. They were gaining experience, seeing similar errors more than once.
I accounted for growing familiarity by narrowing the time window I examined. The least-impressive metrics put the reduction at 18 minutes to 5 minutes.
Pictures…
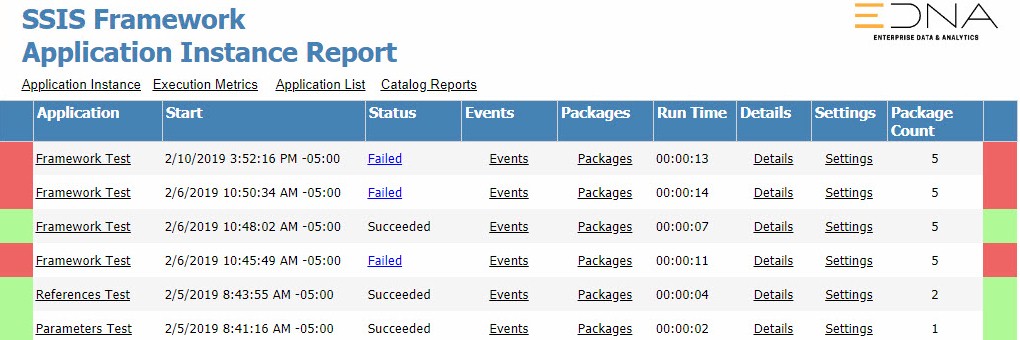
Before I built and deployed the dashboard for SSIS Application Instances (like the one pictured at the top of this post), on-call people would query custom-logging tables we built to monitor enterprise data integration. The queries to return Application Instance log data were stored where everyone could reach them. In fact, I used the same queries as sources for this report.
A funny thing happened when I deployed the reports. Each week, one or more on-call people would ping me and tell me how much they liked the reports. Even though the data was the same, the presentation was different. A picture with a little color goes a long way.
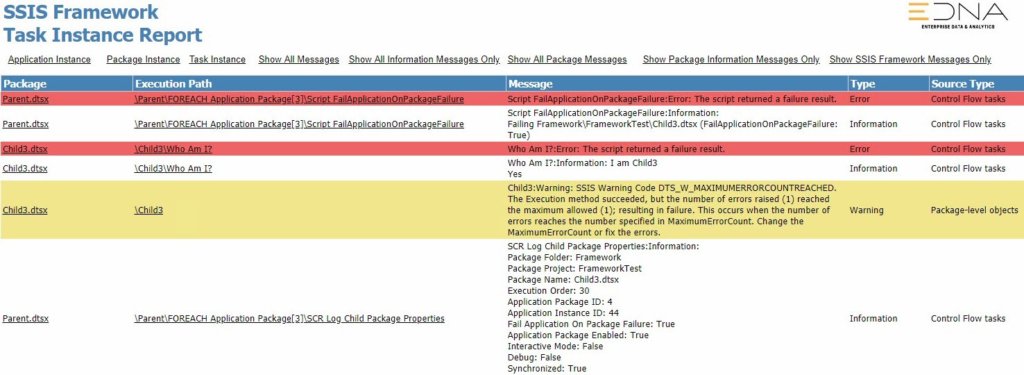
The image at the beginning of this section – the SSIS Framework Task Instance Report – is displayed when a user clicks the Failed link shown in the initial screenshot. This design received he most comment by the on-call team members. The most common comment was, “I click the Failed link and it takes me to details about the failure.” The reports were passing The 2:00 AM Test.
SSIS Framework Applications
If you’ve read this far and wondered, “Andy, what’s an SSIS Application?” An SSIS Application is a construct I came up with to describe a collection of SSIS Packages configured to execute in a specific order. An application is a way to group SSIS packages for execution. You can get a sense of how our frameworks work – especially the application execution functionality – by checking out the SSIS Framework Community Edition at DILM Suite (DILM == Data Integration Lifecycle Management).
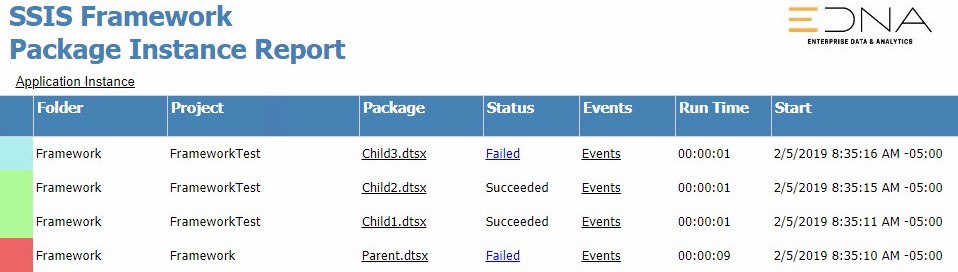
An Application Instance is an instance of execution of an SSIS Application. An Application Instance is made up of Package Instances. the relationship between applications and packages appears straightforward: an application is a collection of packages; parent-child; one-to-many. But it’s not quite that simple. Our SSIS Frameworks facilitate patterns that execute the same package multiple times, sometimes in parallel! We can also create packages that perform utility functions – such as ArchiveFile.dtsx – and call it from multiple applications. When you do the Boolean algebra, the relationship between applications and packages is many-to-many.
Our SSIS Frameworks are SSIS Catalog-integrated. They even work with the SSIS Integration Runtime that’s part of Azure Data Factory, Azure-SSIS.
Dashboards… Evolved
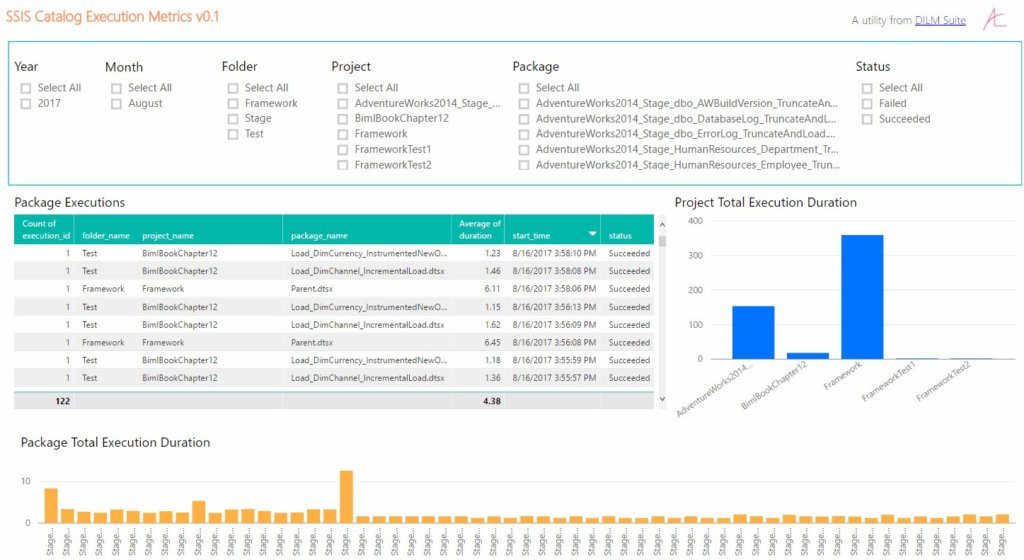
While the Reporting Services dashboard was neat when it was released back in the day, the cool kids now play with Power BI. At DILM Suite you will also find a free – albeit basic – Power BI dashboard that surfaces many of the same metrics using even better reporting technology. The Basic SSIS Catalog Dashboard in Power BI is free at DILM Suite.
I’ve not yet collected Mean Time to Identify Failure metrics using the Basic SSIS Catalog Dashboard in Power BI dashboard. Perhaps you can be the first.
Enjoy!
Comments